No content results match your keyword.
Content
You have successfully logged out.
Not registered yet?
Life-cycle assessment study
Choosing between rigid sterile containers and blue wrap for the sterile processing of OR equipment.
This information is meant for medical professionals only. Please confirm that you are a medical professional before accessing the information.
Confirm Yes, I am a health care professional. Cancel No, I am not a health care professional.A team of researchers made up of physicians and technicians from the Leiden University Medical Center in the Netherlands and biomedical and industrial design engineers from Delft University of Technology performed an in-depth life cycle-assessment comparing blue wrap and rigid sterile containers (RSCs) as systems for processing sterile goods for use in the hospital. The comparison took into account four phases of product life for blue wrap and RSCs: the production phase (including the extraction of material, transport to the production site, and manufacturing), the transport phase (from production site to the hospital), the use phase (washing and sterilization process), and the end-of-life phase (incineration, landfill, and recycling).
Two key findings emerged from this assessment, which is presented in their study “Reducing the Environmental Impact of Sterilization Packaging for Surgical Instruments in the Operating Room: A Comparative Life Cycle Assessment of Disposable versus Reusable Systems”:
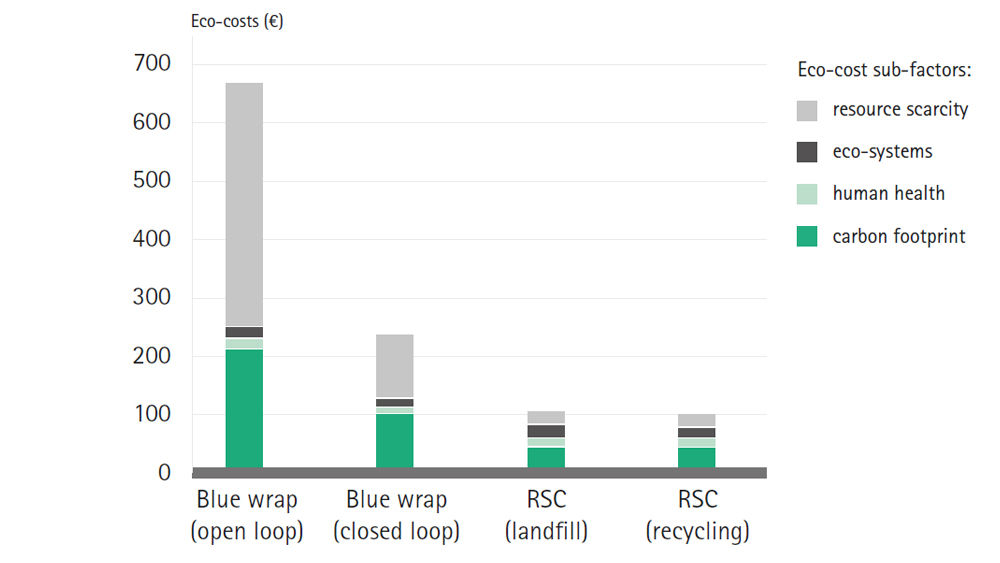
The use of RSCs has 84% lower eco-costs than when blue wrap is used to package surgical instruments for sterilization. This difference is of such an order of magnitude that the container is more environmentally friendly after only 68 of 5,000 postulated use cycles.
Eco-costs of blue wrap vs. rigid sterile containers (RSCs)
Over 5,000 sterilization cycles
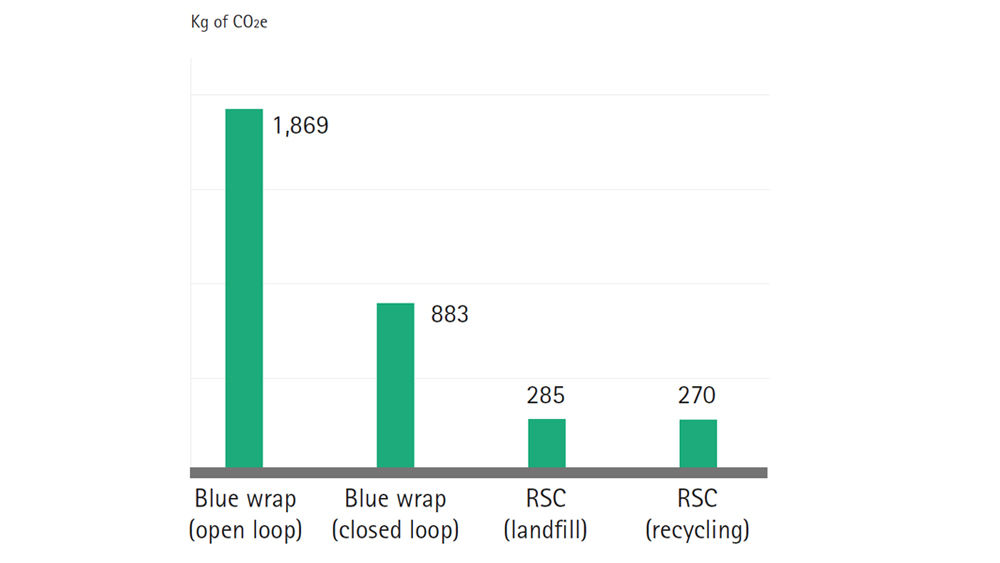
Using the less comprehensive carbon footprint life-cycle assessment metric, blue wrap produces 1,869 kg of CO2e over 5,000 sterilization cycles in open loop use (= without recycling) as opposed to 285 kg of CO2e for RSCs – making blue wrap more than 6 times as carbon intensive in comparison to RSCs. In closed loop use of blue wrap (= with recycling), the amount of CO2e produced is lower (883 kg), but this depends on full recycling of blue wrap, which rarely occurs.
CO2e generation from blue wrap vs. rigid sterile containers (RSCs)
Over 5,000 sterilization cycles
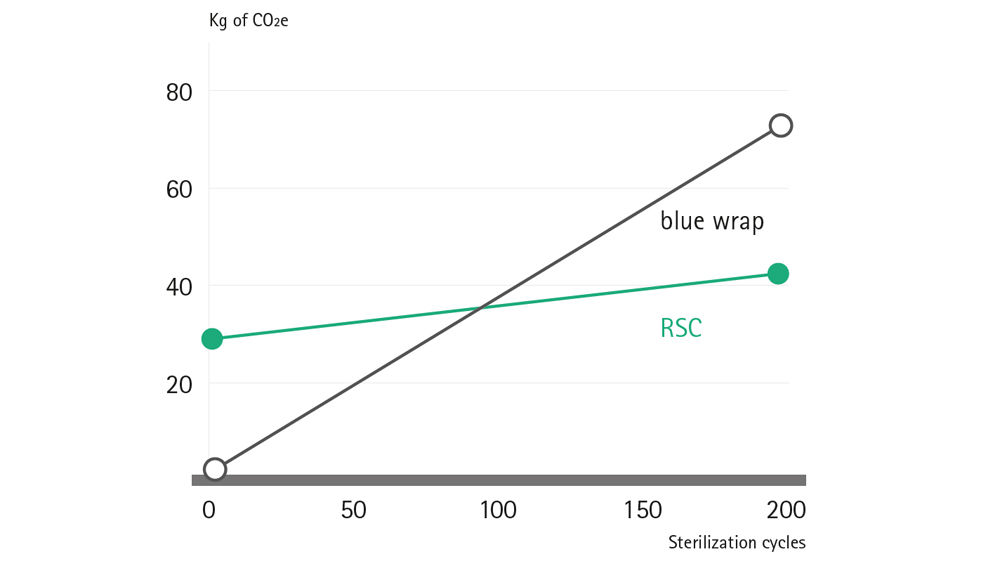
The authors examine the “blue wrap vs. RSC” choice in connection with two basic application situations:
The idea behind this comparison is to determine the environmental breakeven point also at lower levels of use.
The study finds that for the carbon footprint of the two systems, a breakeven point is reached after 98 sterilization cycles. From this point onwards, the RSC system is delivering lower CO2e results, which become more and more significant with each subsequent sterilization cycle:
Environmental breakeven point (CO2e)
After just 98 sterilization cycles, RSCs already start to produce less CO2e than blue wrap, with the differential continuing to grow proportionally over the whole RSC product life cycle.
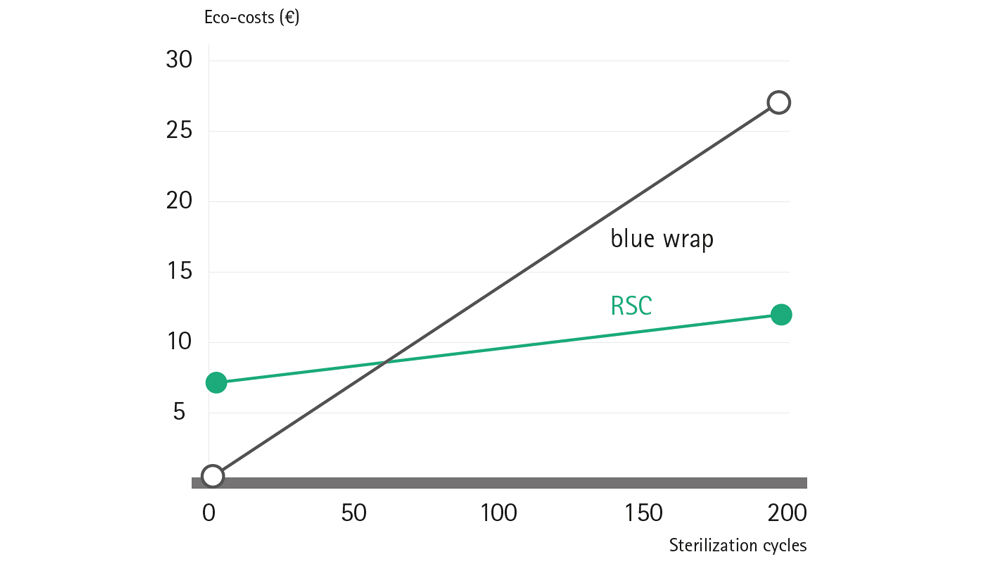
The study finds that for the eco-costs of the two systems, a breakeven point is reached after 68 sterilization cycles. From this point onwards, the RSC system is generating a lower level of eco-costs, which become more and more significant with each subsequent sterilization cycle:
Environmental breakeven point (eco-costs)
After just 68 sterilization cycles, RSCs already start to achieve better eco-cost results than blue wrap, with the differential continuing to grow proportionally over the whole RSC product life cycle.
On the basis of these findings, the authors write in their conclusion:
